

We are here for you
Thank you! Your submission has been received!
Oops! Something went wrong while submitting the form.
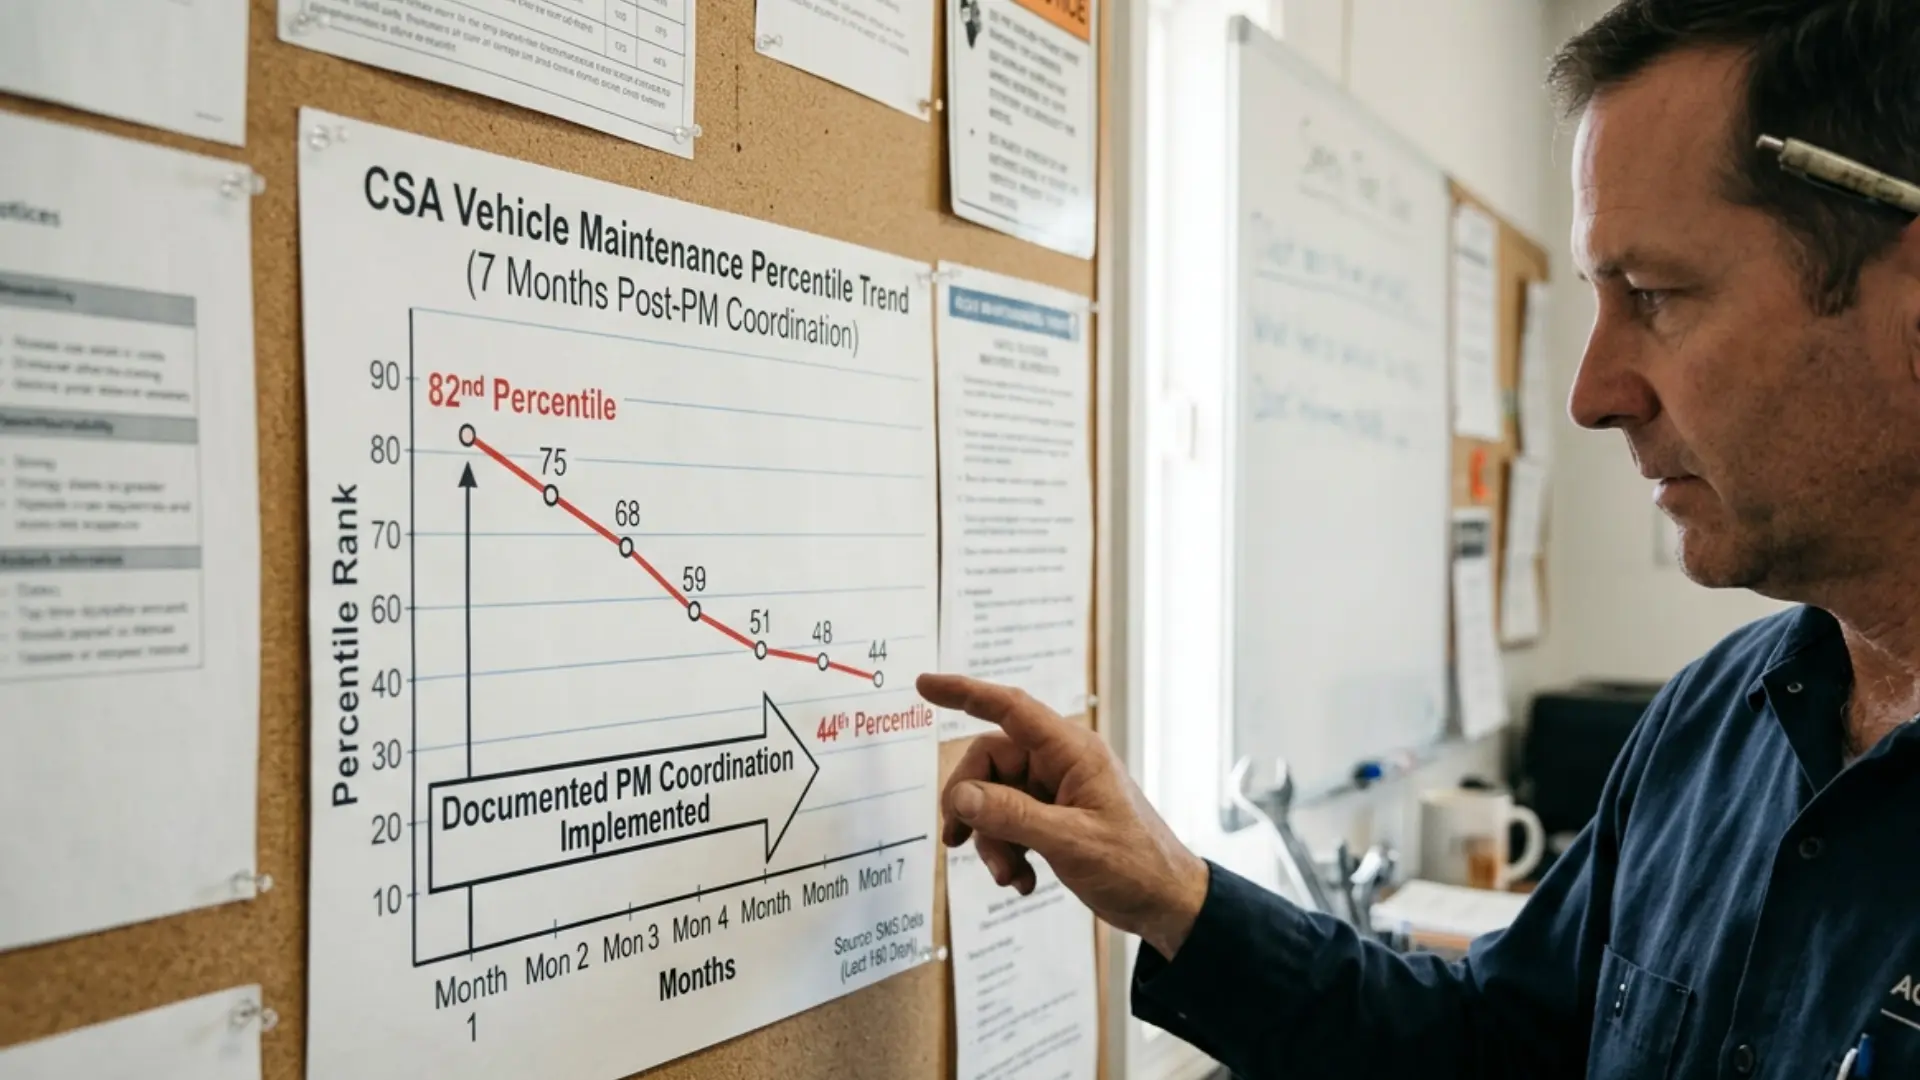

A regional LTL carrier running 94 power units spent 14 months with its Vehicle Maintenance BASIC sitting in FMCSA alert status. After putting every vehicle on a documented PM schedule, the fleet dropped from the 82nd percentile to the 44th in seven months, without filing a single DataQs challenge. The violations simply stopped appearing. That is not a marketing claim. It is the mechanical result of what happens when a carrier's PM execution goes from inconsistent to systematic and documented.
Vehicle Maintenance is the only one of the seven CSA compliance categories where a structured truck preventive maintenance program produces direct, measurable score reduction, because it is the only BASIC built entirely from conditions a maintenance program controls. Unsafe driving depends on driver behavior. Hours of service depends on logbook discipline. Vehicle Maintenance depends on whether brakes, tires, and lights are in compliant condition when a roadside inspector looks at them, and that condition is a direct function of whether the PM program caught the defect before the truck left the yard.
The Federal Motor Carrier Safety Administration's Safety Measurement System scores carriers across seven Behavior Analysis and Safety Improvement Categories, ranking each carrier against similar-sized fleets and assigning a percentile from 0 to 100. A higher percentile means worse relative performance. The Vehicle Maintenance BASIC accounts for a substantial share of total CSA points across most fleet categories, and unlike categories tied to individual driver behavior on the road, every point in it traces back to a missed PM, a deferred repair, or a driver defect report that was not acted on before dispatch.
OxMaint's fleet compliance research puts the figure precisely: 73% of Vehicle Maintenance violations are PM-preventable. These are not surprise mechanical failures. They are gradual deteriorations, brake pad wear approaching the out-of-service threshold, a tire losing tread depth, a marker lamp beginning to fail, that a scheduled PM inspection catches weeks before a roadside inspector does. Brake systems, tires, and lighting account for the top categories of roadside vehicle violations in current CVSA data, and all three are conditions that develop gradually and are fully detectable during routine inspection.
This is the mechanical reason a coordination program's effect on CSA score is not incidental. A program that enforces PM compliance, ensures every scheduled inspection actually happens on interval, and produces documented repair records is directly addressing the root cause of the majority of Vehicle Maintenance violations before they become roadside findings.
A coordination program affects CSA trajectory through two separate mechanisms operating simultaneously, and understanding both is what makes the recovery timeline predictable rather than a vague promise.
The first mechanism is prevention. Every violation avoided at roadside because a defect was caught and corrected during scheduled PM is a violation that never enters the SMS calculation. This is the most direct effect and the one fleet managers intuitively understand. A brake out-of-adjustment condition corrected during a PM visit costs a repair invoice. The same condition found at a scale house costs the repair invoice plus a violation that weighs on the score for a defined period, plus the operational disruption of an out-of-service order, plus the increased scrutiny that follows.
The second mechanism is time decay combined with a clean denominator. CSA scores are calculated on a rolling window, and under the FMCSA's 2026 SMS methodology revisions, that window was shortened, which means violations age off the record faster than under the prior structure. Every clean roadside inspection a coordinated fleet generates adds a positive data point to the percentile calculation while older violations fall out of the window. A fleet that stops generating new violations is not just holding steady. Its percentile actively improves each month as the historical violations that were dragging the score down age out and are replaced by nothing, because the maintenance program is catching what used to become a violation before it ever reaches roadside.
This is why the OxMaint case study shows meaningful movement in months rather than years. The fleet was not disputing old violations. It was preventing new ones while the existing violations aged off on schedule. Both effects compound together.
Fleet managers evaluating a coordination program for its CSA impact should expect a specific timeline rather than an immediate fix. Multiple sourced compliance guides converge on the same window: meaningful percentile improvement in 90 to 180 days from the point a documented, consistent PM program begins.
The reason the timeline is measured in months rather than weeks is structural, not a limitation of the coordination program itself. SMS recalculates monthly, and the percentile reflects a rolling window of inspection data. A single month of clean inspections does not overwrite months of prior violations sitting in the calculation. What moves the score is the accumulation of clean data points over several months combined with the oldest violations aging out of the window, which is why the 82nd-to-44th percentile case took seven months rather than seven weeks. That is still a dramatic and financially significant improvement, and it happened without a single formal dispute, purely from the maintenance program doing what maintenance programs are supposed to do.
For fleets currently sitting above the FMCSA intervention threshold for Vehicle Maintenance, which for most carrier types sits at 80%, this timeline matters because it defines when the operational consequences of a poor score, increased roadside targeting, warning letters, and elevated insurance scrutiny, begin to ease. A fleet manager who understands this timeline going in is positioned to communicate realistic expectations upward rather than promising an immediate fix that the scoring mechanics cannot deliver.
A fleet can perform every PM correctly and still fail to see the CSA benefit if the documentation behind that work does not hold up. This is the piece most fleet managers underestimate, and it is where a coordination program's structural advantage over informal shop relationships becomes most visible.
The FMCSA's DataQs system allows carriers to formally challenge violations that were incorrectly recorded, misclassified, or attributable to circumstances the documentation can refute. Filing a successful DataQs challenge requires timestamped, specific work order evidence tied to the vehicle record, exactly the kind of documentation covered in the dispatcher maintenance checklist article on this site, where the daily discipline of confirming DVIR defect closure and repair certification is what builds that evidence trail in the first place.
A vetted shop network producing consistent work orders, with part numbers, measured conditions, technician identification, and repair certification on every service event, is generating the exact documentation format that both prevents future violations from being disputed and supports a DataQs challenge on any historical violation that was misattributed. A fleet using informal, unvetted shops that produce vague invoices has neither of these protections. The maintenance may have happened, but the fleet cannot prove it in the format FMCSA accepts.
If your fleet's Vehicle Maintenance BASIC has been sitting above the intervention threshold, or trending upward over recent months, the question worth asking is not whether the maintenance is happening. It is whether the maintenance program produces documentation specific enough to demonstrate a systematic PM program to an auditor, and consistent enough to catch the brake, tire, and lighting conditions before they become roadside findings. A coordinated preventive maintenance program through a vetted nationwide network is built around both requirements simultaneously: PM execution that catches defects before dispatch, and documentation that holds up when FMCSA reviews the record.
If you want to understand what your fleet's current Vehicle Maintenance trajectory implies and what a documented PM program would realistically produce on your timeline, reach out through the contact page with your current CSA data and fleet profile. That conversation, with your actual percentile history in front of us, produces a more specific answer than industry averages can.
This article draws on the following sources:



.webp)